# -*- coding: utf-8 -*-
import tornado.httpserver
import tornado.ioloop
import tornado.options
import tornado.web
import os
import plotly
import plotly.graph_objs as go
import random
import math
from tornado.options import define, options
define("port", default=8000, help="run on the given port",
type=int)
class IndexHandler(tornado.web.RequestHandler):
def graph(self):
plot_obj =
plotly.offline.plot({
"data":
[go.Scatter(x=[1, 2, 3, 4], y=[4, 5, 2, 8])],
"layout":
go.Layout(title="hello world"),
}, auto_open=False,
output_type="div")
return plot_obj
def get(self):
self.render("index.html", title="Scatter",
graph01=self.graph())
# https://plotly.com/python/3d-mesh/
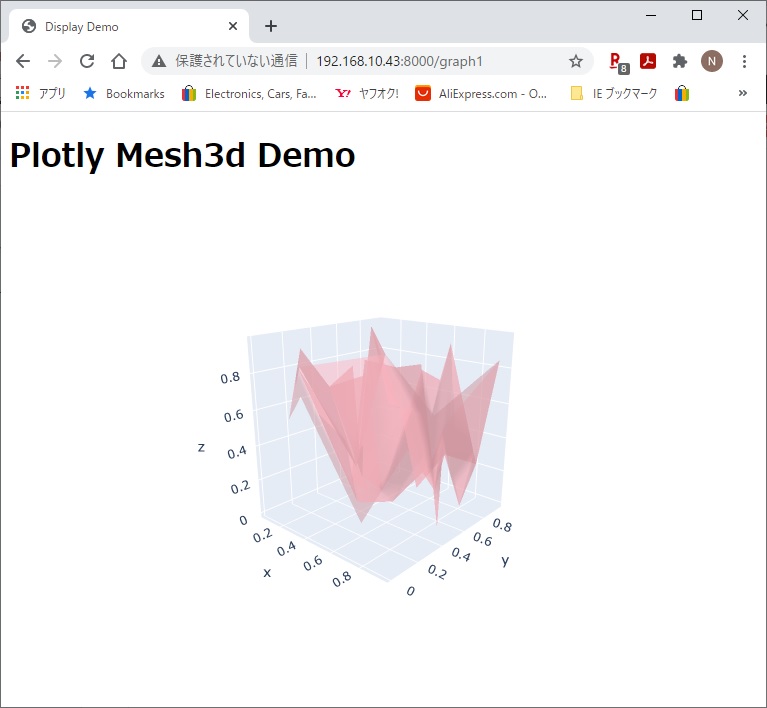
class Graph1Handler(tornado.web.RequestHandler):
def graph(self):
x = []
y = []
z = []
for i in range(50):
x.append(random.random())
y.append(random.random())
z.append(random.random())
layout = dict(
margin = dict( # グラフ領域の余白設定
l = 0, r = 0, t = 0, b = 0,
pad = 0,
# グラフから軸のラベルまでのpadding
autoexpand = True, #
LegendやSidebarが被ったときに自動で余白を増やすかどうか
),
scene = dict( # 3Dグラフ用の設定
camera = dict(
eye = dict(
x= 1.88,
y= -2.12,
z= 0.96
)
)
)
)
plot_obj =
plotly.offline.plot({
"data":
[go.Mesh3d(x=x, y=y, z=z, color='lightpink',
opacity=0.50)],
"layout":
go.Layout(layout),
}, auto_open=False,
output_type="div")
return plot_obj
def get(self):
self.render("index.html", title="Mesh3d",
graph01=self.graph())
# https://plotly.com/python/3d-line-plots/
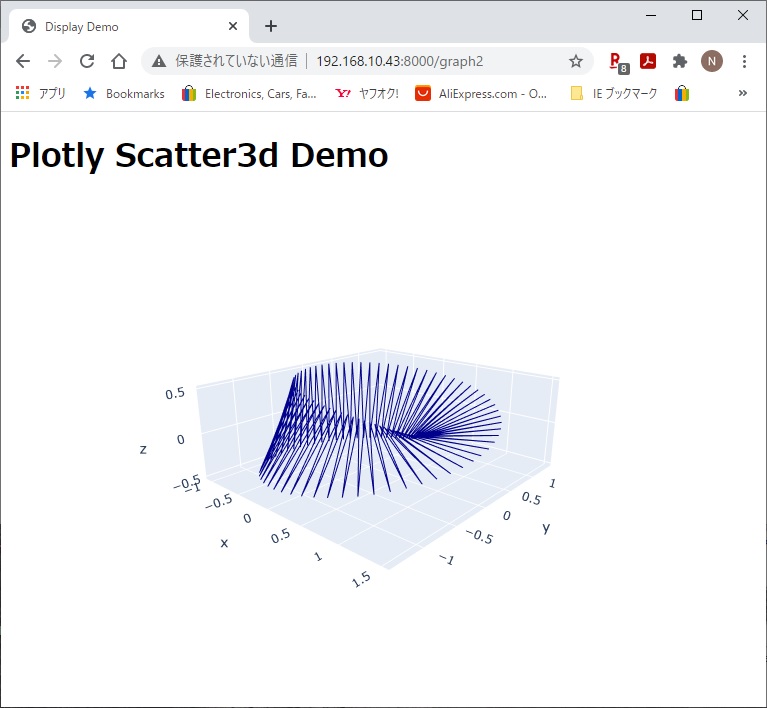
class Graph2Handler(tornado.web.RequestHandler):
def graph(self):
delta = 0.1
pi = 4*math.atan2(1,
1);
x = []
y = []
z = []
u = 0
while u <= 2*pi:
v=-1
while v<1:
x.append((1+(v/2) * math.cos(u/2)) *
math.cos(u))
y.append((1+(v/2) * math.cos(u/2)) *
math.sin(u))
z.append((v/2) * math.sin(u/2))
v=v+delta
u=u+delta
layout = dict(
margin = dict( # グラフ領域の余白設定
l = 0, r = 0, t = 0, b = 0,
pad = 0,
# グラフから軸のラベルまでのpadding
autoexpand = True, #
LegendやSidebarが被ったときに自動で余白を増やすかどうか
),
scene = dict( # 3Dグラフ用の設定
camera = dict(
eye = dict(
x= 1.88,
y= -2.12,
z= 0.96
)
)
)
)
line =
dict(color='darkblue',width=2)
plot_obj =
plotly.offline.plot({
"data":
[go.Scatter3d(x=x, y=y, z=z, mode="lines", line=line)],
"layout":
go.Layout(layout),
}, auto_open=False,
output_type="div")
return plot_obj
def get(self):
self.render("index.html", title="Scatter3d",
graph01=self.graph())
if __name__ == "__main__":
tornado.options.parse_command_line()
app = tornado.web.Application(
handlers=[
(r"/", IndexHandler),
(r"/graph1", Graph1Handler),
(r"/graph2", Graph2Handler),
],
template_path=os.path.join(os.getcwd(),
"templates"),
static_path=os.path.join(os.getcwd(), "static"),
debug=True
)
http_server =
tornado.httpserver.HTTPServer(app)
http_server.listen(options.port)
tornado.ioloop.IOLoop.current().start()
|