Flaskを使ってみる

テーブル作成ライブラリ


Flaskを使ってテーブル(表)を含むページの作り方は、色々なところで紹介されていますが、
flask_tableという表作成専用のライブラリがこちらで公開されています。
日本語のページが見当たらないので簡単に紹介します。

インストールは以下の通りです。
$ pip install flask-table


pythonコード(table.py)は以下の通りです。
#!/usr/bin/python
#-*- coding: utf-8 -*-
# https://github.com/plumdog/flask_table
from flask_table import Table, Col
from flask import Flask, render_template


app = Flask(__name__)

class Item(object):
    def __init__(self, name, description):
        self.name = name
        self.description = description


class ItemTable(Table):
    name = Col('Name')
    description = Col('Description')


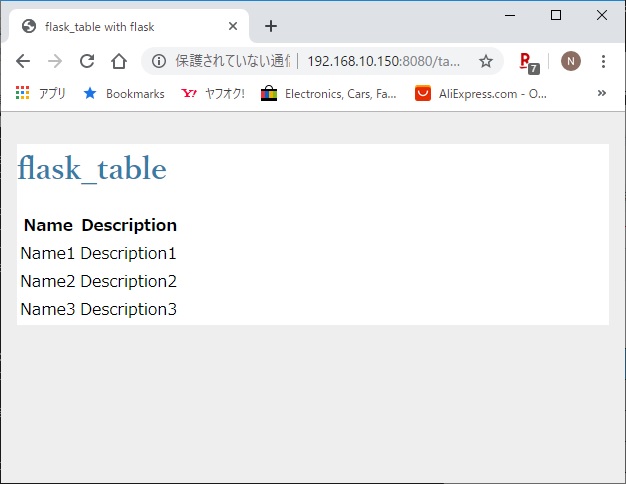
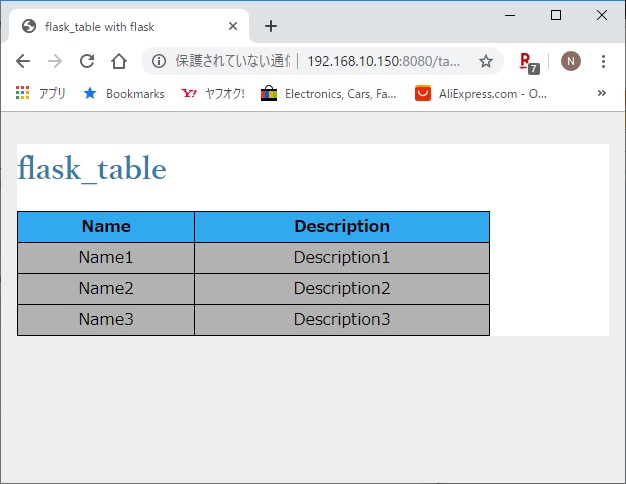
@app.route('/table')
def table():
    items = [Item('Name1', 'Description1'),
             Item('Name2', 'Description2'),
             Item('Name3', 'Description3')]

    table = ItemTable(items)

    # or {{ table }} in jinja
    print(table.__html__())
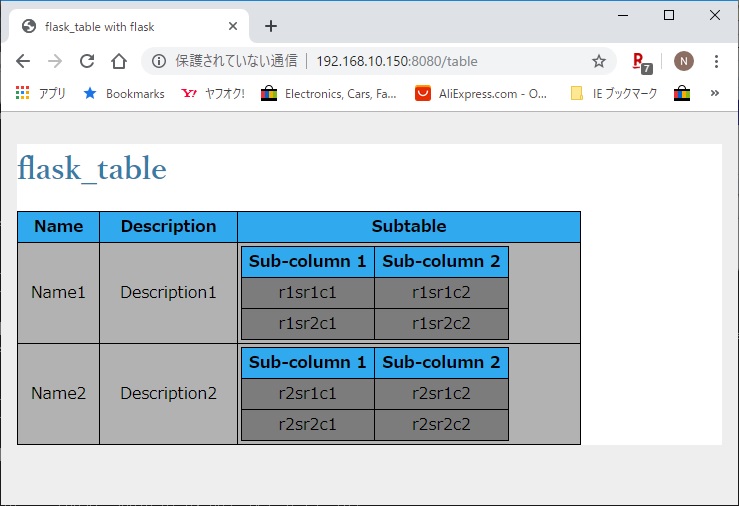
    return render_template('table.html', title='flask_table', table=table)


if __name__ == '__main__':
    app.run(host='0.0.0.0', port=8080, debug=True)

テンプレートファイル(table.html)は以下の様になります。
<!DOCTYPE html>
   <head>
      <meta http-equiv="Pragma" content="no-cache">
      <meta http-equiv="Cache-Control" content="no-cache">
      <title>flask_table with flask</title>
      <link type="text/css" rel="stylesheet" href="{{ url_for('static', filename='style.css') }}"/>
   </head>

   <body>
      <h1>{{ title }}</h1>
      {{ table }}
   </body>
</html>

実行すると以下のテキストを生成して、テンプレートの{{ table }}に埋め込みます。
<table>
<thead><tr><th>Name</th><th>Description</th></tr></thead>
<tbody>
<tr><td>Name1</td><td>Description1</td></tr>
<tr><td>Name2</td><td>Description2</td></tr>
<tr><td>Name3</td><td>Description3</td></tr>
</tbody>
</table>

罫線も何もないテーブルです。


テンプレートにテーブルに関するstyleを追加すると見た目ががらりと変わります。
<!DOCTYPE html>
   <head>
      <meta http-equiv="Pragma" content="no-cache">
      <meta http-equiv="Cache-Control" content="no-cache">
      <title>flask_table with flask</title>
      <link type="text/css" rel="stylesheet" href="{{ url_for('static', filename='style.css') }}"/>
   </head>

   <style>
   table {
   border-collapse: collapse;   /* 隣接するセルの罫線を重ねて表示する */
   font-family: "メイリオ", sans-serif;/* フォントのスタイルを指定する */
   color: #000000;      /* フォントの色を指定する */
   width: 80%;  /* テーブルの横幅を指定する */
   }
   td, th {
   border: 1px solid #000000;   /* 境界線を実線で指定する */
   background-color: rgba(0,0,0,0.3);/* 背景色を指定する */
   text-align: center;  /* インライン要素の位置を指定する */
   padding: 3px;        /* 要素の余白を指定する(上下左右) */
   }
   th {
   background-color: #31A9EE;   /* 見出しの背景色を指定する */
   }
   </style>

   <body>
      <h1>{{ title }}</h1>
      {{ table }}
   </body>
</html>


ライブラリ側には表の装飾機能を一切持たず、装飾はテンプレートのstyleに任せているところが潔いです。


こちら
のサンプルを実行すると、以下の様に各列でソートを行うことができます。
おそらく作者の方は、これがやりたかったのではないでしょうか?


この様な複雑なテーブルも簡単に作ることができます。


こちらにテーブルをデータグリッドにするための JavaScriptライブラリが公開さ れています。
こちらに使い方が公 開されています。
そこで、上記の記事を参考に、flaskと組み合わせて使ってみました。

pythonコード(datatable.py)は以下の通りです。
20行、4列のデータをリストに格納して、テンプレートに渡します。
#!/usr/bin/env python
# -*- coding: utf-8 -*-
from flask import Flask, render_template, redirect
import random
app = Flask(__name__)

@app.route("/")
def index():
    itemsList = []
    for index in range(20):
        string1 = "line#{:2d}".format(index)
        string2 = "comment#{}".format(index)
        number1 = random.randint(0, 100)
        number2 = random.randint(0, 100)
        items = []
        items.append(string1)
        items.append(string2)
        items.append(number1)
        items.append(number2)
        itemsList.append(items)
    templateData = {
       'itemsList': itemsList,
       }
    return render_template('datatable11.html', **templateData)

if __name__ == "__main__":
    app.run(host='0.0.0.0', port=8080, debug=True)

テンプレートファイル(datatable11.html)は以下の様になります。
pythonの2重ループを使ってitemListからデータを取り出しています。
<!DOCTYPE html>
<head>
<title>DataTables</title>
<link type="text/css" rel="stylesheet" href="{{ url_for('static', filename='style.css') }}"/>
</head>

<body>
<table>
  <thead>
    <tr>
      <th>line</th>
      <th>comment</th>
      <th>number1</th>
      <th>number2</th>
    </tr>
  </thead>
  <tbody>
    {% for items in itemsList %}
      <tr>
        {% for item in items %}
          <td>{{ item }}</td>
        {% endfor %}
      </tr>
    {% endfor %}
  </tbody>
</table>
</body>
</html>

実行すると罫線も何もない素っ気ないテーブルを表示します。


次にテンプレートを一部変更し、jqueryとdataTablesのライブラリを組み込みます。
dataTablesはjqueryのDOM操作を利用しています。
<!DOCTYPE html>
<head>
<title>DataTables</title>
<link type="text/css" rel="stylesheet" href="{{ url_for('static', filename='style.css') }}"/>

<!-- Plugin styles -->
<link rel="stylesheet" type="text/css" href="https://cdn.datatables.net/1.10.22/css/jquery.dataTables.css">

<!--  jQuery v3.5.1 -->
<script
  src="https://code.jquery.com/jquery-3.5.1.min.js"
  integrity="sha256-9/aliU8dGd2tb6OSsuzixeV4y/faTqgFtohetphbbj0="
  crossorigin="anonymous">
</script>

<!-- JS Pluging -->
<script type="text/javascript" src="https://cdn.datatables.net/1.10.22/js/jquery.dataTables.js"></script>

<script>
$(document).ready( function () {
    $('#data-table').DataTable();
} );
</script>

</head>

<body>
<table id="data-table">
  <thead>
    <tr>
      <th>line</th>
      <th>comment</th>
      <th>number1</th>
      <th>number2</th>
    </tr>
  </thead>
  <tbody>
    {% for items in itemsList %}
      <tr>
        {% for item in items %}
          <td>{{ item }}</td>
        {% endfor %}
      </tr>
    {% endfor %}
  </tbody>
</table>
</body>
</html>

たったこれだけで見た目ががらりと変わります。
デフォルトでは10行ごとにページングして表示します。


それぞれの項目でソートができるので、数値を扱うテーブルの表示や、データベースから取り出した値の表示では非常に強力なライブラリです。
以下はnumber1の項目でソートした表示です。


dataTablesライブラリのカスタマイズとオプションの指定はこちらが 詳しいです。


dataTableライブラリとよく似たライブラリがこちらに公開されて います。
デモページへのリンクが切れていますが、こち らがデモページです。
テンプレートを以下の様に変更し、dataTableと比べてみました。
dynatableのオプションはこ ちらのコードを参考にしました。
<!DOCTYPE html>
<head>
<title>DataTables</title>
<link type="text/css" rel="stylesheet" href="{{ url_for('static', filename='style.css') }}"/>

<!--    Bootstrap v2.3.2 -->
<link rel="stylesheet" media="all" href="https://s3.amazonaws.com/dynatable-docs-assets/css/bootstrap-2.3.2.min.css" />
<!-- Plugin styles -->
<link rel="stylesheet" media="all" href="https://s3.amazonaws.com/dynatable-docs-assets/css/jquery.dynatable.css" />
<link rel="stylesheet" type="text/css" href="https://cdn.datatables.net/1.10.22/css/jquery.dataTables.css">

<!--  jQuery v3.5.1 -->
<script
  src="https://code.jquery.com/jquery-3.5.1.min.js"
  integrity="sha256-9/aliU8dGd2tb6OSsuzixeV4y/faTqgFtohetphbbj0="
  crossorigin="anonymous">
</script>

<!-- JS Pluging -->
<script type='text/javascript' src='https://s3.amazonaws.com/dynatable-docs-assets/js/jquery.dynatable.js'></script>
<script type="text/javascript" src="https://cdn.datatables.net/1.10.22/js/jquery.dataTables.js"></script>

<script>
$(document).ready( function () {
    $('#data-table').DataTable({
        displayLength: 5
    });
} );
</script>

<script>
$(document).ready(function() {
    $('#dyna-table').dynatable({
        dataset: {
             perPageDefault: 5
        }
    });
} );
</script>

</head>

<body>
<table id="data-table" width="100%">
  <thead>
    <tr>
      <th>line</th>
      <th>comment</th>
      <th>number1</th>
      <th>number2</th>
    </tr>
  </thead>
  <tbody>
    {% for items in itemsList %}
      <tr>
        {% for item in items %}
          <td>{{ item }}</td>
        {% endfor %}
      </tr>
    {% endfor %}
  </tbody>
</table>
<hr size="10">
<table id="dyna-table" width="100%">
  <thead>
    <tr>
      <th>line</th>
      <th>comment</th>
      <th>number1</th>
      <th>number2</th>
    </tr>
  </thead>
  <tbody>
    {% for items in itemsList %}
      <tr>
        {% for item in items %}
          <td>{{ item }}</td>
        {% endfor %}
      </tr>
    {% endfor %}
  </tbody>
</table>
</body>
</html>

上側のテーブルがdataTables、下側のテーブルがdynatableで作った表示です。
非常によく似ていますが、dataTablesのデフォルトの設定は1行の高さが大きく設定されています。


これは以下のスタイルをテンプレートに追加することで変更することができます。
dataTablesの見た目の変更はこちらに 詳しく紹介されています。
<style>
#dyna-table thead th{
    padding-top: 10px;
    padding-bottom: 10px;
}
#data-table tbody td{
    padding-top: 1px;
    padding-bottom: 1px;
}
</style>

行の高さは同じになりましたが、各列のallignの設定が違います。


dynatableでは数値項目のソートが正しく動きません。
以下の表示はどちらもnumber1の項目を昇順に表示していますが、dynatableでは29→3の順になります。


続く...