#!/usr/bin/python
#-*- encoding: utf-8 -*-
from bokeh.plotting import figure, output_file, show
from bokeh.embed import components
from bokeh.resources import INLINE
from bokeh.util.string import encode_utf8
from flask import Flask, render_template
app = Flask(__name__)
@app.route('/bokeh2')
def bokeh2():
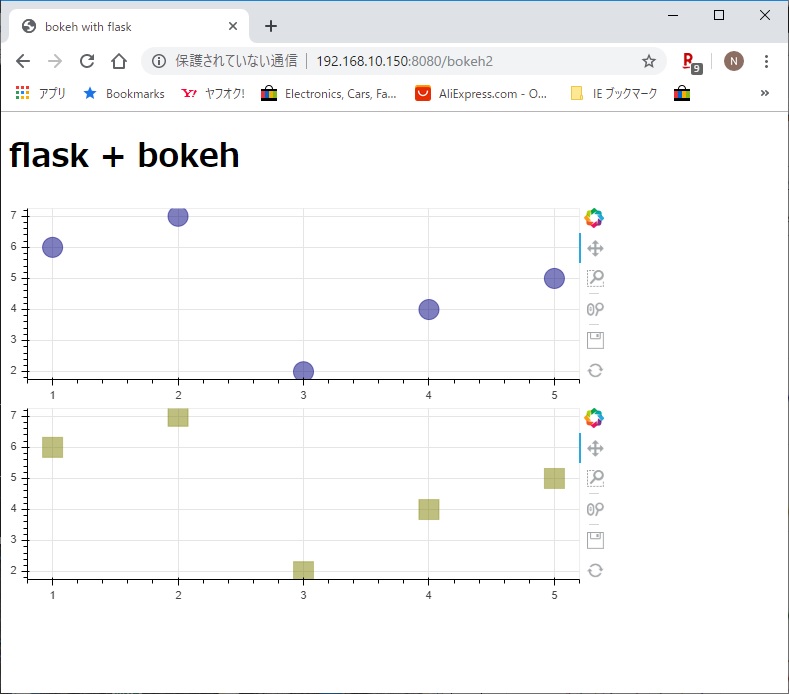
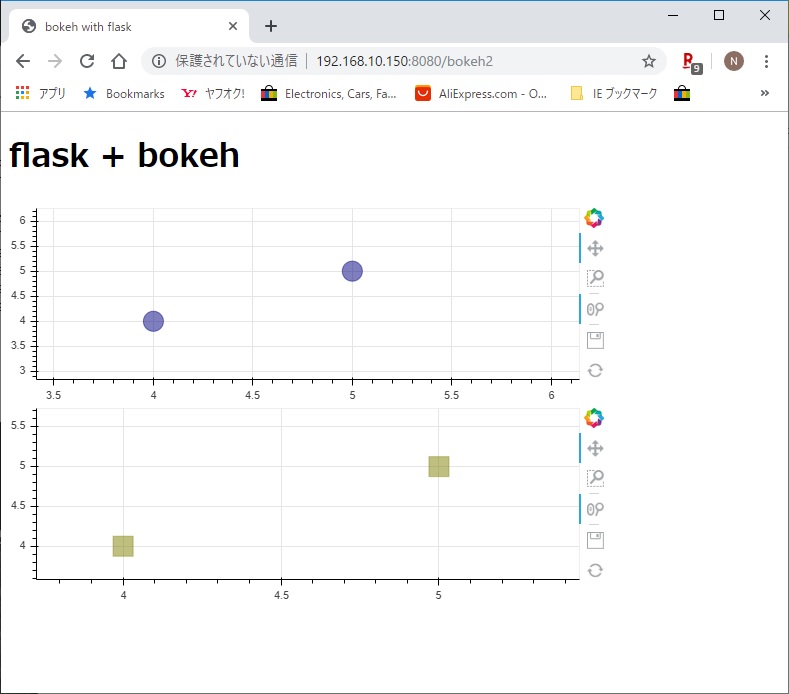
#First Plot
fig1 = figure(plot_width=600,
plot_height=200)
fig1.circle([1, 2, 3, 4, 5], [6, 7, 2, 4, 5],
size=20, color="navy", alpha=0.5)
#Second Plot
fig2 = figure(plot_width=600,
plot_height=200)
fig2.square([1, 2, 3, 4, 5], [6, 7, 2, 4, 5],
size=20, color="olive", alpha=0.5)
# grab the static resources
js_resources = INLINE.render_js()
css_resources = INLINE.render_css()
# render template
script1, div1 = components(fig1)
script2, div2 = components(fig2)
html = render_template(
'multi.html',
title='flask +
bokeh',
plot_script1=script1,
plot_div1=div1,
plot_script2=script2,
plot_div2=div2,
js_resources=js_resources,
css_resources=css_resources,
)
return encode_utf8(html)
if __name__ == "__main__":
app.run(host='0.0.0.0', port=8080,
debug=True)
|